

Every homelabber reaches a point where running htop and df -h in a loop simply isn’t enough anymore. When your self-hosted ecosystem grows, having real-time, historical visibility into your hardware becomes a necessity.
This is the story of my newly found love for Grafana and how I set up a robust, visually stunning monitoring stack for my personal homelab repository, night-tower.
The Catalyst: Why Monitoring Matters#
A few weeks ago, one of my dockerized media servers quietly ran out of disk space, bringing down several adjacent services and leaving me with a corrupted database.
It was a classic homelab disaster—one that could have been completely avoided with proper alerting and visualization.
I decided it was time to move away from raw terminal queries and build a centralized mission control center.
The Stack: Prometheus, Node Exporter & Docker#
To feed data into Grafana, I set up a standard, open-source monitoring triad. The entire stack is containerized for easy deployment and isolation:
- Node Exporter: Runs as a lightweight daemon on the host hardware, exporting raw system metrics (CPU, memory, disk, network) in a format readable by Prometheus.
- Prometheus: A time-series database that scrapes the metrics from Node Exporter at set intervals (e.g., every 15 seconds) and stores them.
- Grafana: The frontend visualization layer that connects to Prometheus as a data source, querying the database and rendering the data into dashboards.
All of this is defined and version-controlled inside my night-tower configurations, keeping deployments completely reproducible.
Dashboard Tour & Exploration#
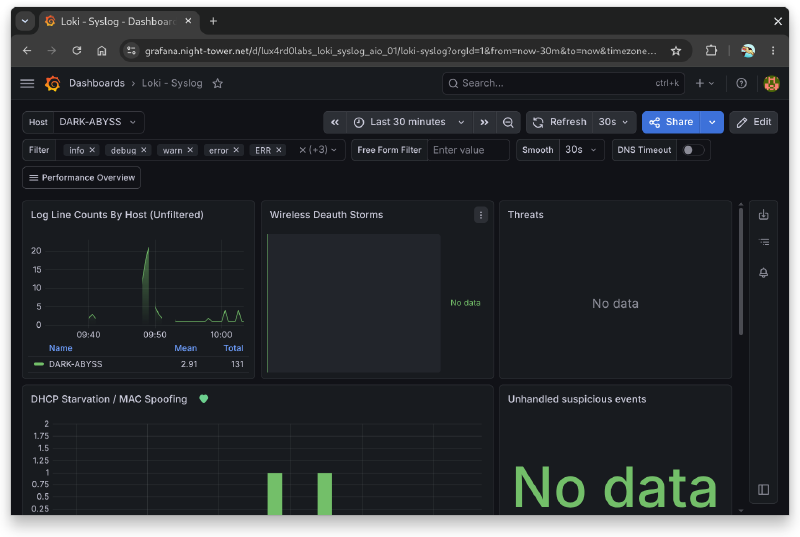
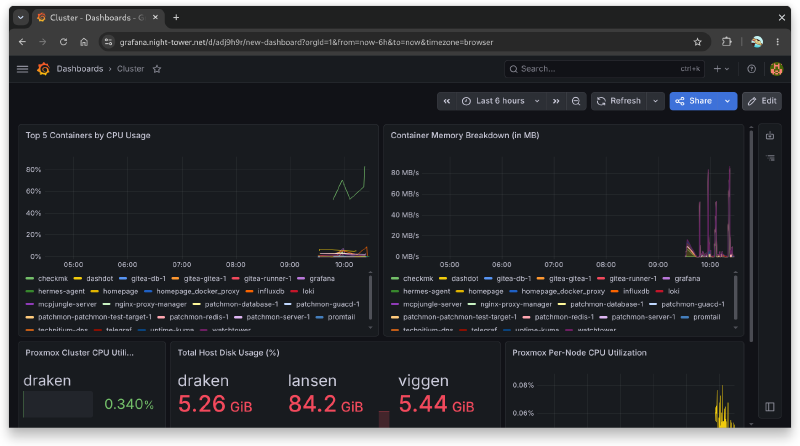
Once the data source was connected, I spent hours tuning my dashboard to highlight the most critical stats. Here is a hands-on look at what is currently running:
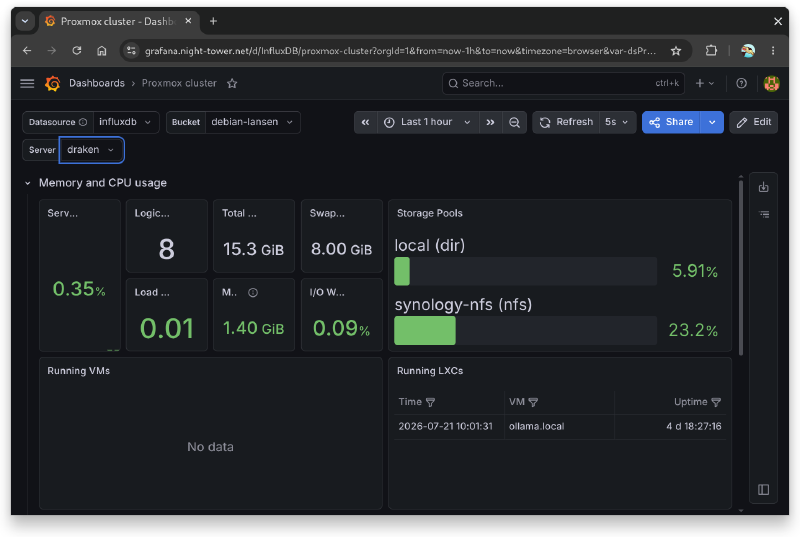
Having historical charts allows me to see patterns—like CPU spikes when daily backups trigger at 3:00 AM, or RAM usage creeping up over several days due to memory leaks in some custom experimental scripts.
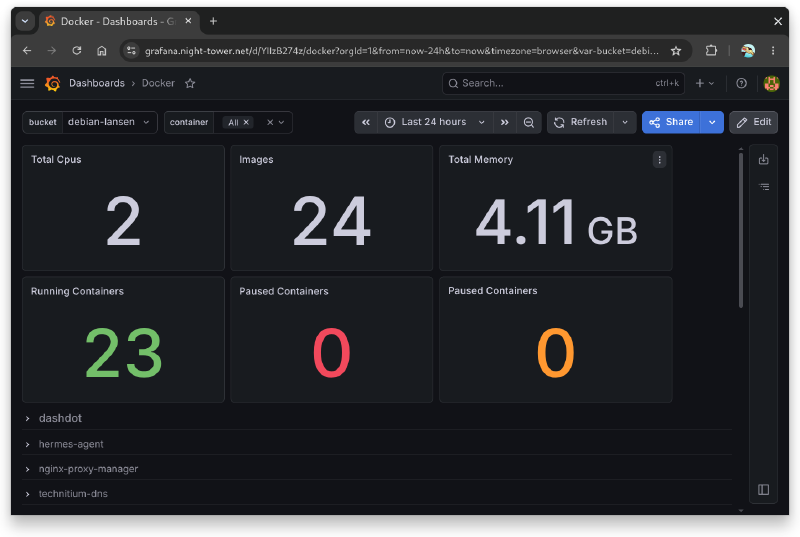
Monitoring the network interface is especially useful for tracking wardriving logs or sync operations when raw packet captures are running in the background.
Lessons Learned & Future Plans#
Setting up Grafana has completely changed how I interact with my homelab. Here are my main takeaways:
- Visualizing makes anomalies obvious: It is easy to ignore a slow server, but seeing a persistent 95% RAM usage line makes it impossible to ignore.
- Alerting is the next step: I’ve integrated Grafana alerts with a local Discord webhook. Now, if any mount point exceeds 90% capacity, I get a direct ping immediately.
- Historical data helps sizing: Looking at past metrics helped me realize I was over-allocating RAM to some virtual machines, allowing me to reclaim resources for new projects.
What does your monitoring stack look like?#
Are you running Grafana and Prometheus, or do you prefer lighter alternatives like Netdata or Glances? Let’s swap dashboard configs and tips in the comments below!